
OrangeCRM Home Page
 Click one of the links listed above
to jump to a section on this page.
The OrangeCRM Home Page is a reporting dashboard which conveniently provides a comprehensive group of primary reports in one convenient location. We recommend that you visit the dashboard on the Home Page daily to check the status of your CRM and obtain the latest data. This feature is designed to save you time by providing a quick, simple overview of the performance within your CRM.
The OrangeCRM Home Page consists of the following 6 tabs: Programs, Estimates, Fulfillments, Events, Overview and Updates. Within these tabs you will find a series of easy to read reports, charts and graphs which provide a quick overview of recent activity within your CRM. You will also find numerous helpful links to additional related reports that can be run directly from the dashboard.
 Some
of the tabs on the home page may not be visible if you have restricted
access rights. If you require additional permissions, please contact your
CRM administrator.
Regardless of which page you are currently viewing in OrangeCRM, you can always get to the Home Page by clicking on the Home button in the upper left corner.

After clicking on the Home button, the Home Page will be displayed. The default view of the Home Page is set to the Programs Tab. However, you may click on any of the other 5 tabs to change your view.
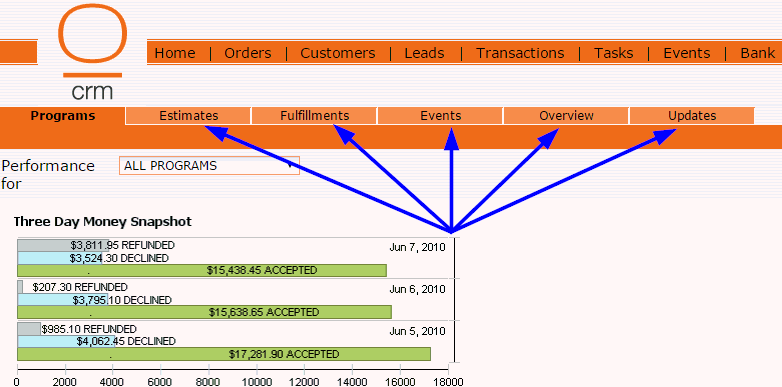
Please see the 6 sections below for a description of how each tab on the Home Page can be used.
The Programs tab displays 4 Program reports and contains hyperlinks to an additional 12 related reports.
 If
some or all of the reports do not load properly, simply use your web browser's
refresh button to refresh the page.
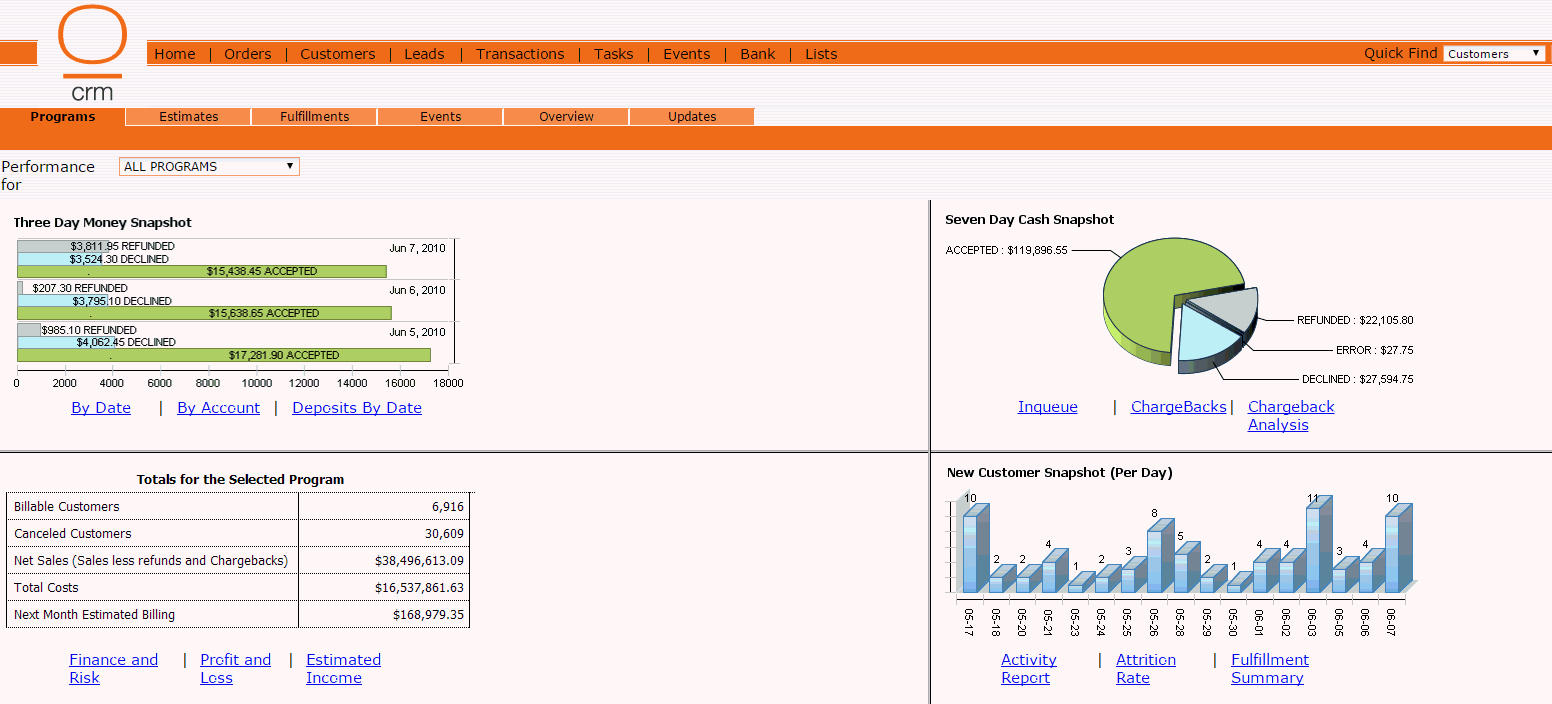
The drop down list located in the upper left corner allows you to choose if you want to view the performance for one specific Program or for All Programs in the CRM.

Three Day Money Snapshot
The Three Day Money Snapshot report is located in the upper left portion of the Programs tab. It uses a horizontal bar graph to show the total dollar amount of each transaction status in the last three days.
 Keep in mind that the totals displayed in the
report are limited to the program you selected in the drop down list at
the top of the Programs tab. If you selected to see performance for all
programs, the totals displayed will include data from all the programs
in your CRM.
Below the bar graph are three blue hyperlinks to the following related transaction reports that can be run directly from the Home Page:
By Date - Runs the Transaction Summary By Date report.
By Account - Runs the Transaction Summary By Account Code report.
Deposits By Date - Runs the Deposit Summary By Date report.
For more information on these reports, please see the Transaction Reports topic.
Seven Day Cash Snapshot
The Seven Day Cash Snapshot report is located in the upper right portion of the Programs tab. It uses a pie chart to show the total dollar amount of each transaction status in the last seven days.
 Keep in mind that the totals displayed in the
report are limited to the program you selected in the drop down list at
the top of the Programs tab. If you selected to see performance for all
programs, the totals displayed will include data from all the programs
in your CRM.
Below the pie chart are three blue hyperlinks to the following related transaction and bank reports that can be run directly from the Home Page:
Inqueue - Runs the Inqueue Transaction Summary report.
ChargeBacks - Runs the Transactions For Dates in Chargeback Status report.
Chargeback Analysis - Runs the Chargeback Analysis report.
For more information on these reports, please see the topics titled Transaction Reports and Bank Reports.
Totals for the Selected Program
The Totals for the Selected Program report is located in the lower left portion of the Programs tab. It uses a chart to show the total billable customers, canceled customers, net sales, total costs and next month estimated billing.
 Keep in mind that the totals displayed in the
report are limited to the program you selected in the drop down list at
the top of the Programs tab. If you selected to see performance for all
programs, the totals displayed will include data from all the programs
in your CRM.
Below the chart are three blue hyperlinks to the following related transaction reports that can be run directly from the Home Page:
Finance and Risk - Runs the Finance and Risk By Acquisition Center report.
Profit and Loss - Runs the Profit and Loss report.
Estimated Income - Runs the Estimated Billing report.
For more information on these reports, please see the Transaction Reports topic.
New Customer Snapshot Per Day
The New Customer Snapshot Per Day report is located in the lower right portion of the Programs tab. It uses a vertical bar graph to show the total number of new customers created in your CRM per day.
 Keep in mind that the totals displayed in the
report are limited to the program you selected in the drop down list at
the top of the Programs tab. If you selected to see performance for all
programs, the totals displayed will include data from all the programs
in your CRM.
Below the bar graph are three blue hyperlinks to the following related customer reports that can be run directly from the Home Page:
Activity Report - Runs the Customer Activity report.
Attrition Rate - Runs the Program Rate of Attrition report.
Fulfillment Summary - Runs the Fulfillments Summary By Program report.
For more information on these reports, please see the Customer Reports topic.
The Estimates tab displays 3 Estimate reports and contains hyperlinks to an additional 3 related reports.
 If
some or all of the reports do not load properly, simply use your web browser's
refresh button to refresh the page.
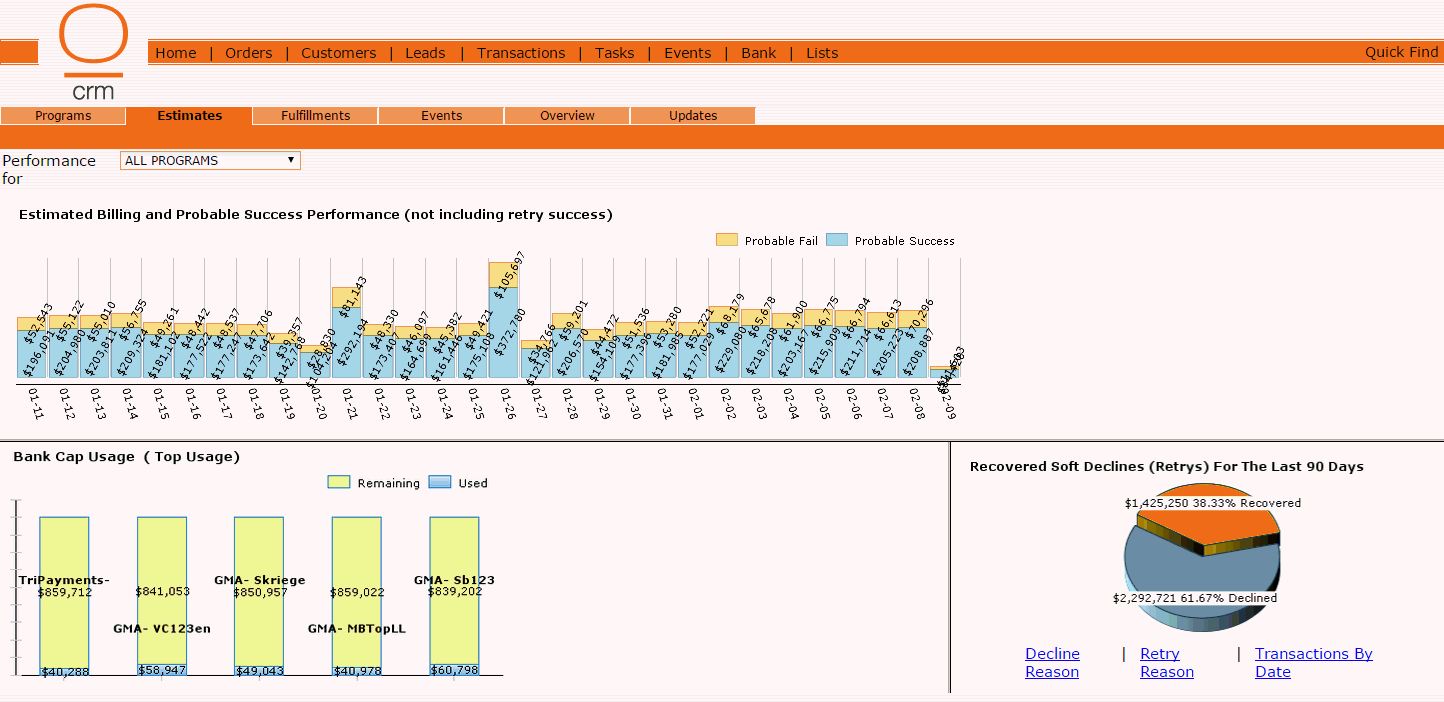
The drop down list located in the upper left corner allows you to choose if you want to view the performance for one specific Program or for All Programs in the CRM.
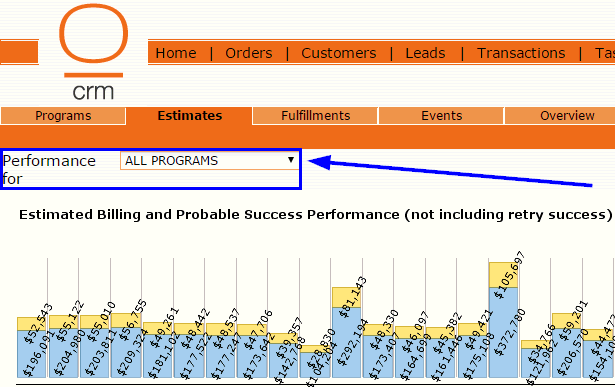
Estimated Billing and Probable Success Performance
The Estimated Billing and Probable Success Performance report is located in the upper half of the Estimates tab. It uses a vertical bar graph to show the total dollar amount of probable success transactions versus probable fail transactions by day, for the next thirty days.
 Keep in mind that the totals displayed in the
report are limited to the program you selected in the drop down list at
the top of the Programs tab. If you selected to see performance for all
programs, the totals displayed will include data from all the programs
in your CRM.
Bank Cap Usage
The Bank Cap Usage report is located in the lower left portion of the Estimates tab. It uses a vertical bar graph to show the estimated total dollar amount used versus the estimated total dollar amount remaining for each bank cap. The total dollar amount used represents the actual amount used plus the amount of probable success transactions estimated to be processed within the remaining daily or monthly time frame limits, which are configured in the Limits tab of the Merchant Bank record. For more information on daily/monthly bank cap limits, please see the topic titled Banks.
 Keep in mind that the totals displayed in the
report are limited to the program you selected in the drop down list at
the top of the Programs tab. If you selected to see performance for all
programs, the totals displayed will include data from all the programs
in your CRM.
Recovered Soft Declines (Retries) For The Last 90 Days
The Recovered Soft Declines report is located in the lower right portion of the Estimates tab. It uses a pie chart to show the total dollar amount of recovered retry transactions versus declined retry transactions in the last ninety days.
 Keep in mind that the totals displayed in the
report are limited to the program you selected in the drop down list at
the top of the Programs tab. If you selected to see performance for all
programs, the totals displayed will include data from all the programs
in your CRM.
Below the pie chart are three blue hyperlinks to the following related transaction reports that can be run directly from the Home Page:
Decline Reason - Runs the Transaction Decline and Retry Summary report. When selecting the report parameters, choose the option to only show declines.
Retry Reason - Runs the Transaction Decline and Retry Summary report. When selecting the report parameters, choose the option to only show retries.
Transactions By Date - Runs the Transactions Summary By Date report.
For more information on these reports, please see the Transaction Reports topic.
The Fulfillments tab displays 3 Fulfillment reports and contains hyperlinks to an additional 3 related reports.
 If
some or all of the reports do not load properly, simply use your web browser's
refresh button to refresh the page.

The drop down list located in the upper left corner allows you to choose if you want to view the performance for one specific Program or for All Programs in the CRM.

Daily Fulfillments Sent
The Daily Fulfillments Sent report is located in the upper half of the Fulfillments tab. It uses a vertical bar graph to show the total number of each type of fulfillment by day, for the last thirty days.
 Keep in mind that the totals displayed in the
report are limited to the program you selected in the drop down list at
the top of the Programs tab. If you selected to see performance for all
programs, the totals displayed will include data from all the programs
in your CRM.
Response Status of Fulfillments
The Response Status of Fulfillments report is located in the lower left portion of the Fulfillments tab. It uses a pie chart to show the total number of each fulfillment response status in the last thirty days.
 Keep in mind that the totals displayed in the
report are limited to the program you selected in the drop down list at
the top of the Programs tab. If you selected to see performance for all
programs, the totals displayed will include data from all the programs
in your CRM.
Below the pie chart are three blue hyperlinks to the following related customer reports that can be run directly from the Home Page:
Fulfillment Summary - Runs the Fulfillments Summary By Program report.
API Summary - Runs the Customer Summary By API report.
Email Tracking - Runs the Email Fulfillment and Response Tracking report.
For more information on these reports, please see the Customer Reports topic.
Triggers For Fulfillments
The Triggers For Fulfillments report is located in the lower right portion of the Fulfillments tab. It uses a pie chart to show the total number of fulfillments for each trigger type in the last thirty days.
 Keep in mind that the totals displayed in the
report are limited to the program you selected in the drop down list at
the top of the Programs tab. If you selected to see performance for all
programs, the totals displayed will include data from all the programs
in your CRM.
The Events tab displays 3 Event reports.
 If
some or all of the reports do not load properly, simply use your web browser's
refresh button to refresh the page.

The drop down list located in the upper left corner allows you to choose if you want to view the performance for one specific Program or for All Programs in the CRM.
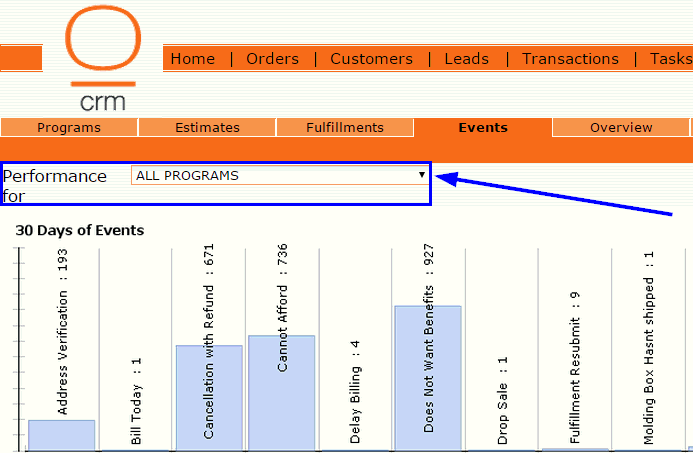
30 Days of Events
The 30 Days of Events report is located in the upper half of the Events tab. It uses a vertical bar graph to show the total number of times each Event was performed in the last thirty days.
 Keep in mind that the totals displayed in the
report are limited to the program you selected in the drop down list at
the top of the Programs tab. If you selected to see performance for all
programs, the totals displayed will include data from all the programs
in your CRM.
30 Days of Event Triggers
The 30 Days of Event Triggers report is located in the lower left portion of the Events tab. It uses a pie chart to show the total number of Events by Trigger Type in the last thirty days.
 Keep in mind that the totals displayed in the
report are limited to the program you selected in the drop down list at
the top of the Programs tab. If you selected to see performance for all
programs, the totals displayed will include data from all the programs
in your CRM.
7 Days of Event Groups
The 7 Days of Event Groups report is located in the lower right portion of the Events tab. It uses a pie chart to show the total number of Events by Performance Group in the last seven days.
 Keep in mind that the totals displayed in the
report are limited to the program you selected in the drop down list at
the top of the Programs tab. If you selected to see performance for all
programs, the totals displayed will include data from all the programs
in your CRM.
The Overview tab displays a snapshot of 6 different types of Overview reports. Although some or all of the report snapshots may be truncated, you can click on the blue See Full Report hyperlinks to view the entire report.
 If
some or all of the reports do not load properly, simply use your web browser's
refresh button to refresh the page.
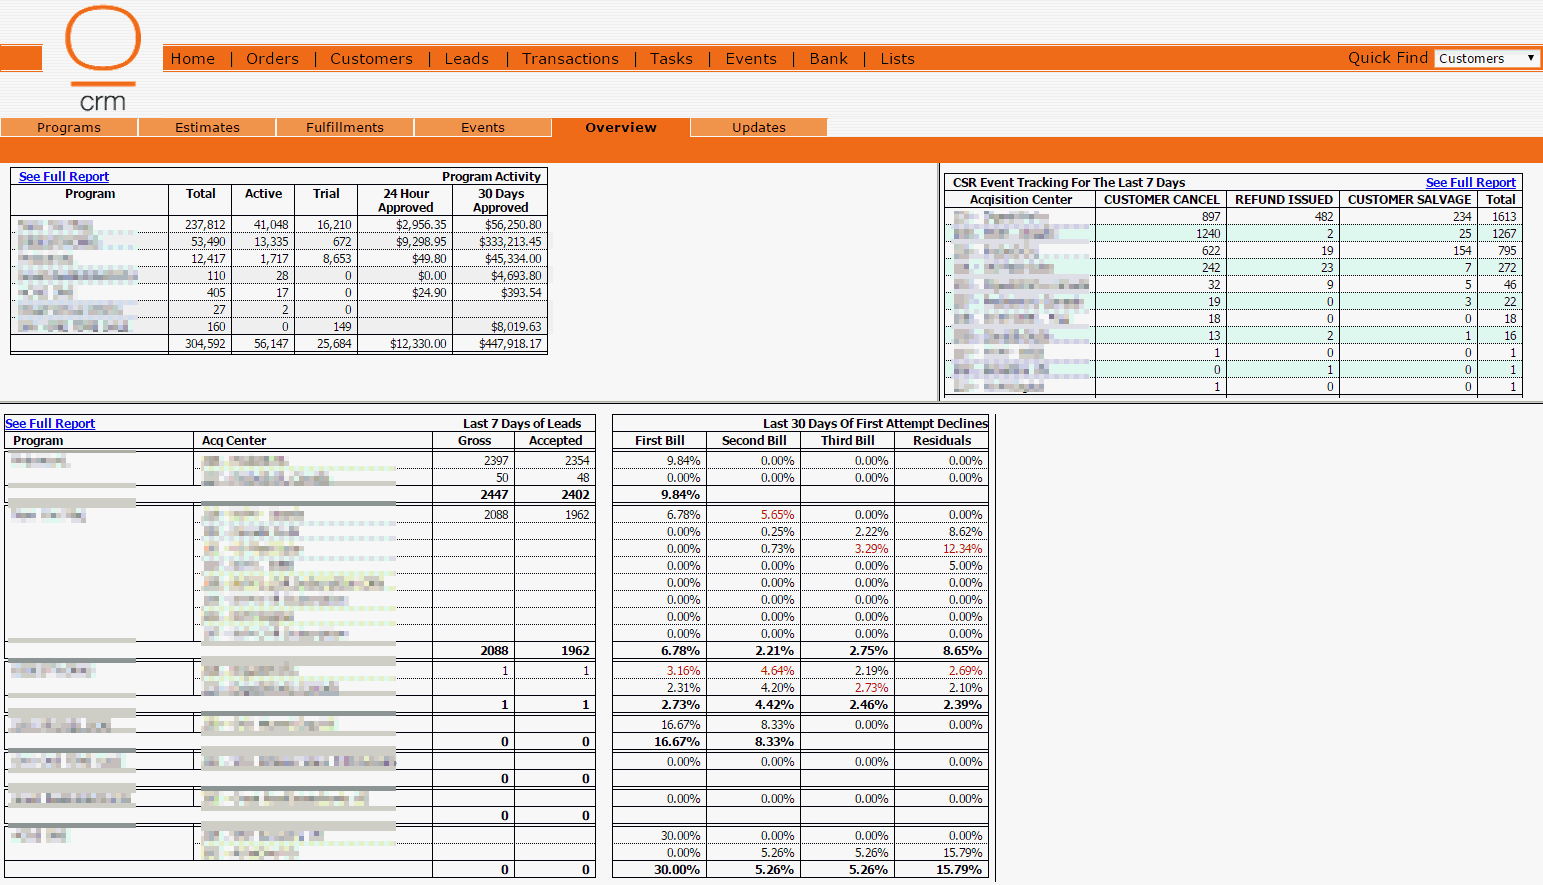

Program Activity
The Program Activity Report is located in the upper left portion of the Overview tab. It displays the following customer and transaction totals for each Program in your CRM:
Total - The total number of customers in each Program.
Active - The total number of customers in Active status in each Program.
Trial - The total number of customers in Trial status in each Program.
24 Hour Approved - The total dollar amount of transactions in Approved status within the last 24 hours.
30 Days Approved - The total dollar amount of transactions in Approved status within the last 30 days.
CSR Event Tracking For The Last 7 Days
The CSR Event Tracking Report is located in the upper right portion of the Overview tab. It provides the following Event totals for each Acquisition Center in the last seven days:
Customer Cancel - The total number of Events performed in the last 7 days with the Customer Cancel Trigger.
Refund Issued - The total number of Events performed in the last 7 days with the Refund Issued Trigger.
Customer Salvage - The total number of Events performed in the last 7 days with the Customer Salvage Trigger.
Total - The combined total number of Customer Cancel, Refund Issued and Customer Salvage Events performed in the last 7 days.
Last 7 Days of Leads
The Last 7 Days of Leads Report is located in the middle left portion of the Overview tab. It displays the following lead totals for each Program and each Acquisition Center in the last seven days:
Gross - The total number of leads uploaded in the last 7 days.
Accepted - The total number of leads in Accepted status in the last 7 days.
Last 30 Days of First Attempt Declines
The Last 30 Days of First Attempt Declines Report is located in the middle right portion of the Overview tab. It provides the following percentages of transactions that were declined on the first attempt in each Program and each Acquisition Center in the last thirty days:
Initial - The percentage of first attempt declines in the last 30 days that occurred on the initial charge (billing cycle zero).
First Bill - The percentage of first attempt declines in the last 30 days that occurred in the first billing cycle.
Second Bill - The percentage of first attempt declines in the last 30 days that occurred in the second billing cycle.
Third Bill - The percentage of first attempt declines in the last 30 days that occurred in the third billing cycle.
Residuals - The percentage of first attempt declines in the last 30 days that occurred in the fourth billing cycle or later.
Chargeback Percentages For This Month
The Chargeback Percentages Report is located in the lower left portion of the Overview tab. It displays the following chargeback data for the current calender month by credit card type for each Bank and each Program:
# - The quantity of transactions that were marked as a chargeback in this calander month.
Percentile - The percentage of transactions that became a chargeback in this calendar month.
Refund Percentages For The Last 90 Days Per Cycle
The Refund Percentages Report is located in the lower right portion of the Overview tab. It displays the following refund percentages for each Program in the last ninety days:
Initial - The percentage of refunds issued on the initial charge (billing cycle zero) in the last 90 days.
First - The percentage of refunds issued in the first billing cycle in the last 90 days.
Second - The percentage of refunds issued in the second billing cycle in the last 90 days.
Third - The percentage of refunds issued in the third billing cycle in the last 90 days.
Residuals - The percentage of refunds issued in the fourth billing cycle or later in the last 90 days.
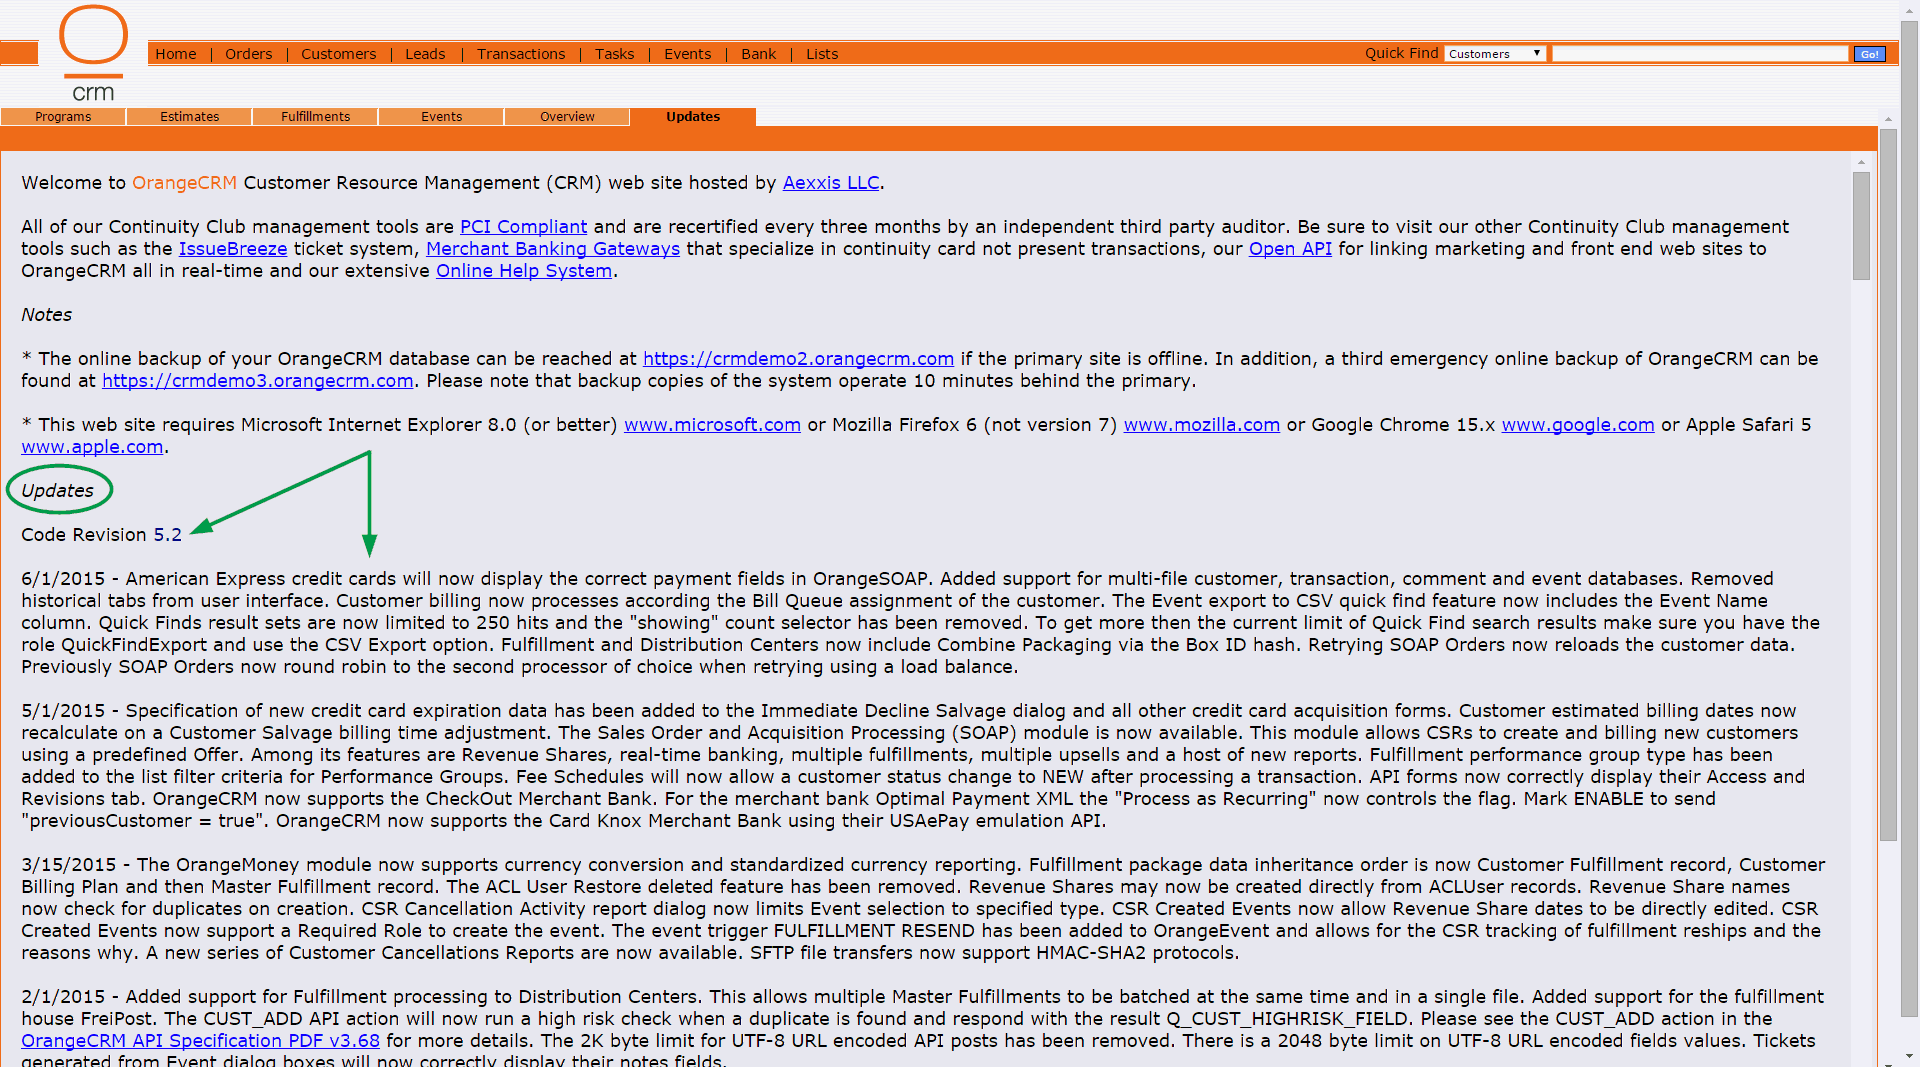
The Updates tab contains important information about your CRM.

The first paragraph explains that OrangeCRM is a web based application hosted by Aexxis LLC. Many people think the name of our company is OrangeCRM. In actuality, OrangeCRM is the name of one of the products we sell. The name of our company is Aexxis LLC. Click on the Aexxis LLC hyperlink to visit our website and view our other product offerings.
The second paragraph notifies you of the fact that OrangeCRM maintains PCI Compliance at all times. This paragraph also includes the following helpful hyperlinks:
PCI Compliant - Brings you to Wikipedia's definition of the term PCI Compliant.
IssueBreeze - Brings you to the OrangeCRM Support web page where you can access our internal ticketing system called IssueBreeze to submit support/service requests.
Merchant Banking Gateways - Displays a downloadable list of merchant bank gateways supported by OrangeCRM.
Open API - Displays OrangeCRM's downloadable API specification document.
Online Help System - Brings you to the OrangeCRM online help manual.
Notes
Under the Notes subheading, you will find two different URLs that can be used to access the online backups of your OrangeCRM database if the primary site is offline, as well as the web browser requirements for using OrangeCRM.

Updates
Under the Updates subheading, the current software version of OrangeCRM is displayed, along with a detailed listing of all the new features/updates that have been released with each software revision. Since OrangeCRM is updated on a quarterly basis, we recommend that users visit the Updates tab on the Home Page on a regular basis to keep up to date on the latest enhancements.
