
Transaction Reports
In this Topic: Hide
 Click one of the links listed above
to jump to a section on this page.
Click one of the links listed above
to jump to a section on this page.
This report will provide a monetary summary of all transactions either processed or issued between your specified dates. As noted below, you select your begin and end dates, your program, and you have the option of viewing the report by the trans processed date or the trans issue date.
![]()
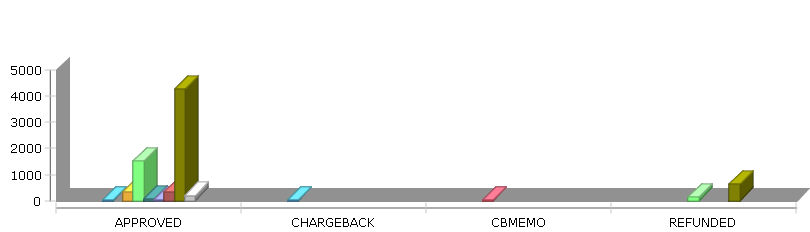
When you click on "Display" and transactions by summary report is displayed in chart and pie format as shown below.
![]()
The transactions are displayed as Cash Flow, Purchases, and Refunds. Each of these types are then further broken out by status.
Cash Flow
Cash flow shows the total dollars amounts processed as purchases and refunds.
Purchases
Purchases shows the total purchases accepted broken out by current customer status. It also shows the number of transactions and status of the transactions that were not able to be processed.
Refunds
Refunds shows the total refund activity broken down by status.
In addition to viewing all transactions for the given dates, you can also breakout the transactions by the following groups: Group by State; Group by Acquisition Center; Group by Affiliate; Group by Affiliate Subcode; and Deposits by Date. To drill down into the Transactions: Summary of Date report, select a grouping link at the top.
Selecting a grouping (such as Group by Acquisition Center) will bring up a summary page of transactions by acquisition center. An example can be seen below.
![]()
Here you see a list of all your acquisition centers and summary information about the transactions under each.
Clicking an acquisition center link (for example, 100 - Aexxis) will result in a new report being displayed, as can be seen below.
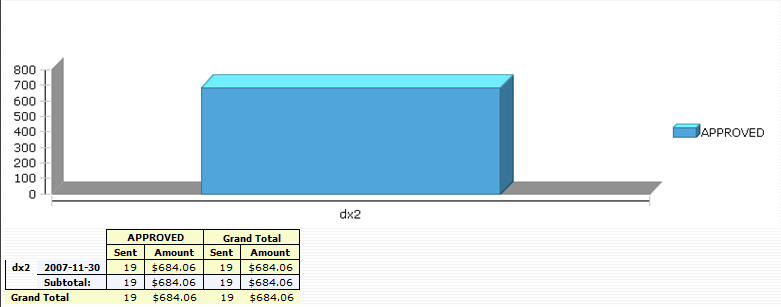
![]()
This report will show your transactions divided between your master account codes and account codes. It will list the approved transaction numbers and dollars amounts for the Preauth, Purchase, and Refund transactions as well as the Grand Totals. You can also group this information by affiliate code and by sub affiliate (as noted at the top of the report).
![]()
This information is also displayed as a chart:
![]()
The transaction summary by account code in table format shows the master account code on the far left and the break down into the separate account codes. Summary information about each is then given. For more detailed information about either the master code or the account code, click on the account code link. An example of master account code: 01001 is shown below.
![]()
Here you see just the one master account code. It breaks up the transactions into their status and their types. The page previous simply gave you the type break out, preauth, purchase, and refund. Here under each you can see the status of the transactions.
Grouping by acquisition center, affiliate code, or sub affiliate code will generate a new report page listing the selected group. Below is an example of the Transaction by Account Code for Acquisition Center report.
![]()
You can drill further down into the report by clicking on one of the acquisition center names. This will result in a detailed report of that acquisition center. Click the 'Back to Selection List' link to go back and select a different acquisition center.
This report will list out your transactions for you by the bank group they went through, which you will select when running the report. As can be seen below, the report will list out for you the card type, and the status of the transaction, wether approved, declined, refunded, error, or retried. It will give you the count of the transactions, and the dollar amount for each.
At the top of the report is a chart that graphically represents the detailed information. It shows you in amounts which statuses at what activity. Hover over any bar to see more information. An example is seen below.
Below the chart is the number break out.
Here you can see detailed information about each card type, and the statuses of the transaction totals for that card type.
You can optionally group by master code via a link at the top of the report. An example of grouping by master code is seen below.
Here the same information is shows, just broken down further by master account codes.
This report will show you all transactions for the given date range for one specific deposit bank. When running the report you chose the deposit bank as a parameter. An example is seen below.
The card types of transactions are listed from top to bottom along the side, followed by the transaction type, from preauth to purchase or refund.
Along the top are listed out the current status of these transactions. With in each status you will see how many transactions are in that status and their total net amount.
The Summary by API report will show you a summary of your transactions as divided by the API as shown below.
This report will list out for you your transactions that are still in queue, or that are on hold. It will give you the actual count, as well as the amount, and the net amount.
The top of the report is a chart. An example is seen below.
This chart shows the total inqueue transaction count for each program. A detailed breakout is below.
This table will list out each program and show the count of inqueue transactions and their amount. It will break down transactions according to their type. Clicking any program will bring up a detailed report about the inqueue transactions for that program. An example is seen below.
This detailed break out shows information for the program selected. It shows inqueue transactions broken out first by type, then by master account code, then by account code. It shows you transactions marked 'Inqueue' and transactions marked 'On Hold'.
Clicking the account code show a new report with inqueue transactions for just that account code. An example can be seen below.
Here you see inqueue information broken down into the dates that the transaction originally occurred on. Clicking the date will result in a new report with detailed information about each inqueue transaction. An example can be seen below.
This detailed information can be useful in resolving inqueue transactions , and getting them to process.
This report will show you all your fee schedules. It will list them out according to the acquisition center they came from, which billing plan they are under, and then divide them according to the account code they are under.
This report will give detailed information about each fee schedule. It is useful for reviewing your set up fee schedules, and ensuring that all the settings are correct. An example can be seen below.
The finance and risk report will give you information about your acquisition centers. It shows their profitability, their rate of return percents of charge backs, refunds system cancels and failed leads. In addition, it will show you averages and print in red numbers that are below average. This report takes into account a 'Soft Cost' for each customer, which is a parameter that is set. The soft cost is the CSR Canceled customer cost. (CSR Cancels multiplied by the cost set when you run the report.) This cost is determined by you, and allows you to include a cost for each customer that had to be canceled by a CSR (CSR Costs).
The report starts out with a chart as seen below.
This chart will show you the profitability of each acquisition center at a glance. It is a return on investment chart, so at 0% you have broken even on what you have invested and anything above 0% is profit.
Below the chart is a listing break out.
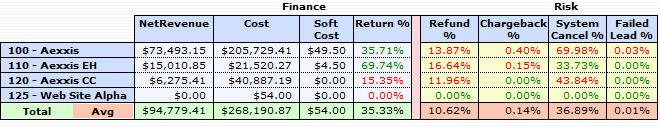
Down the side we break out each acquisition center. Across the top shows information about each acquisition center.
Net Revenue
Income less refunds.
Cost
The total of the cost paid for the customers.
Soft Costs
he CSR Canceled customer cost. (CSR Cancels multiplied by the cost set when you run the report.)
Return %
How profitable that acquisition center is. 100% is even, what you paid out is what you made. Less than 100% is a loss, you paid more than you made. More than 100% is a profit, you made more than you paid out.
Refund %
The percent of customers that were refunded.
Chargeback %
The percent of customers that issued a charge back.
System Cancel %
The percent of customers that the system has canceled.
Failed Lead %
The percent of customers which lead ended up in CSR Lead Check Fail status.
The Trans For Dates in Charge Back report will show you all your transactions that are in status, charge back, for specific dates. This report is accessed from Transactions on the main navigation page. It shows when the original transaction occurred, NOT when the transaction was set into chargeback status. The base report breaks this down by month.
A chart at the top looks as follows.
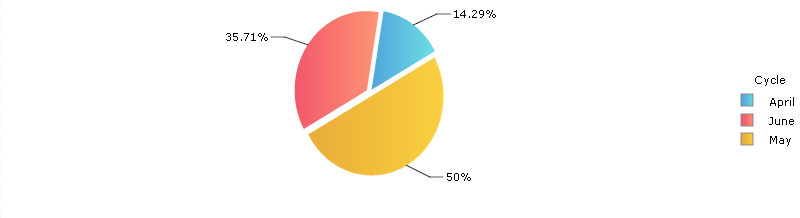
This chart shows the percent of charge backs according to their original transaction date. Below the chart is a number break out. An example is seen below.
Trans
The total transactions for each month. Limited to the begin and end dates.
Charge Backs
The number of the transactions that occurred in that month, that are not in charge back status.
CB Percent
The percent of the chargebacks vs the transactions for that month.
% Liability
The percent of that months charge backs vs the over all total of chargebacks for that month.
Avg Day Delay
The number of days it took, until the transactions went into chargeback for the given time period.
You can optionally select to group this information by affiliate, sub affiliate, BIN (bank ID number), or cycle. By clicking the appropriate link you can chose these grouping. This is seen below.
![]()
Below is an example of the Bank ID Number grouping.
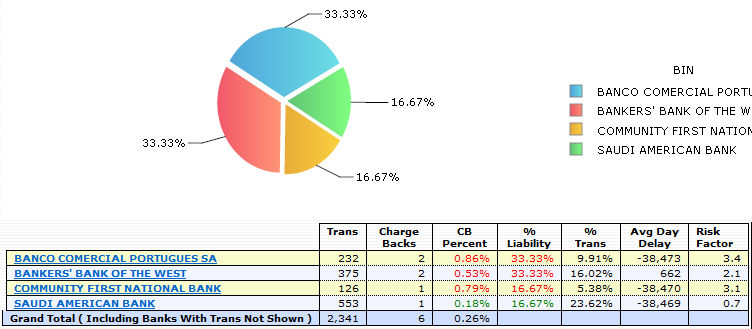
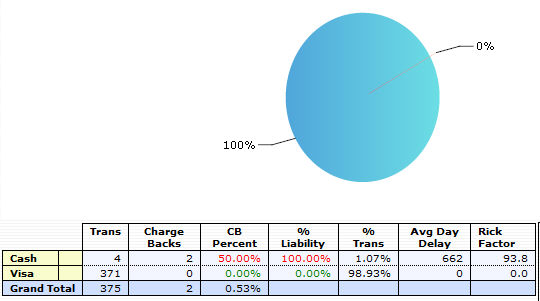
Clicking any individual bank will show you a break out of this bank by card type as seen below.
The Deposit Summary by Date report is accessed from the Transaction tab on the main menu. This report will provide a monetary summary of all deposits from your Merchant accounts to your Deposit bank between your specified dates. As noted below, you select your begin and end dates, and filter by your programs or Merchant bank group.
You can custom select your date ranges or specify only certain dates. Select how you want to display the results: by Program or Merchant bank group.
This reports allows you to see the deposits from your Merchant banks to your Deposit bank on record. The link at the top displays the transactions by date for the date range that you selected.
The report shows the refund amount that are taken out of your deposit bank. Purchases are funds are put into your deposit bank.

To filter your selection by Merchant Bank Group, select that button and enter the Filter value for the Bank. (A pop-up window will appear with a bank list for you to select from.)
This view shows the results when you filter the report by Merchant Bank Group. The report shows the refund amount that are taken out of your deposit bank. Purchases are funds are put into your deposit bank.
This report will provide you with the reason code for your declined transactions. It is accessed from the Transaction menu - Summary by Date. Next, select a specific program or all programs and the date range you want. In the window that opens, click on the Declined Reason Report link in the top right hand corner.
Note: For more information on each reason code, please contact your merchant bank for their documentation on their error codes.