
Note: Depending on your access rights to OrangeCRM, some of the options and views listed below may vary. See Security and Access and Revisions.
This report will show you income and cost information for your customers. It divides this information by the cycle the customer made it to. It is similar to the program rate of attrition report, except it includes cost information and the cycle counter is by the cycle on the transactions, not the cycle on the customer. All information in the report is limited to the program and dates you selected in the parameters.
The top of the report has two charts as shown below.
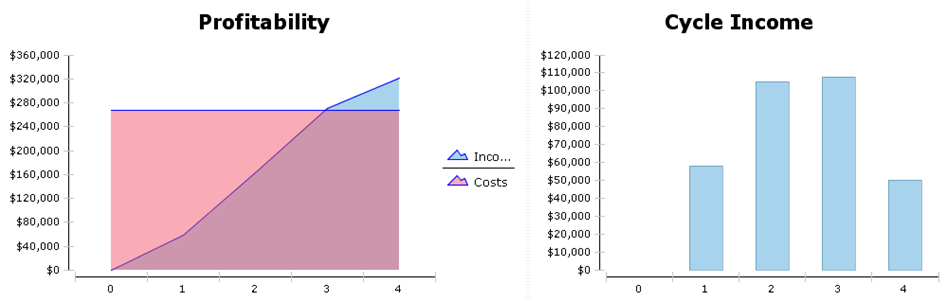
The first chart, Profitability, shows the cost of acquiring the customers in pink and income from those customers in blue. The second chart, Cycle Income, shows the income of the customers in each cycle. Shown below the chart is the number break out.
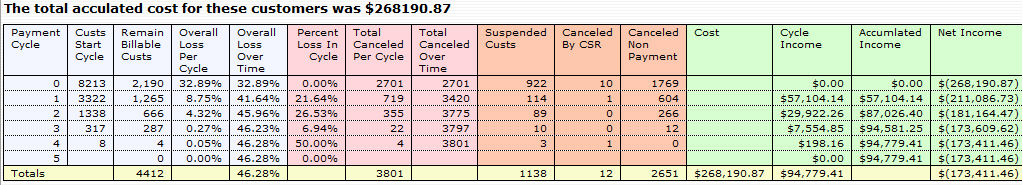
First it shows you the accumulated cost of the customers. This is the total cost of customers listed in this report. The chart fields are as follows.
Payment Cycle - The cycle on the transaction. (Not the cycle on the customer.)
Custs Start Cycle - The count of customers that have a transaction with this cycle number.
Remaining Billable Custs - The count of customers that have not moved on from this cycle for some reason, but should have.
Overall Loss Per Cycle - The percent of customers that were canceled or suspended in this cycle vs the starting count of customers.
Overall Loss Over Time - A running total of the percent of customers that were canceled or suspended in this cycle vs the starting count of customers.
Percent Loss in Cycle - The percent of customers that were canceled or suspended in this cycle vs the customers that started this cycle.
Total Canceled Per Cycle - The number of customers that were canceled or suspended in this cycle.
Total Canceled Over Time - The number of customers that were canceled or suspended as a running total.
Suspended Custs - The number of customers that were suspended in this cycle.
Canceled By CSR - The number of customers that were canceled by CSR's.
Canceled Non Payment - The number of customers that were canceled automatically due to non payment.
Cost - The cost for these customers (total only).
Cycle Income - The total income from customers in this cycle.
Accumulated Income - A running total of income from customers.
Net Income - Profit from these customers. It shows the cycle where you break even.
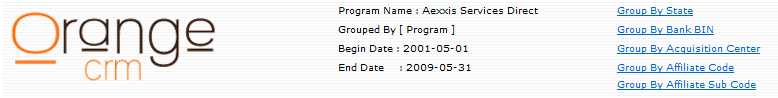
The report can be grouped by state, Bank BIN, acquisition center, affiliate code, and affiliate sub code by selecting the appropriate link at the top of the screen, as seen below.
Selecting a grouping will bring up a new report with a list of groups and summary information as seen below.
Selecting a specific bank from this list will show you the profit and loss report for only that specific selection.